

Description
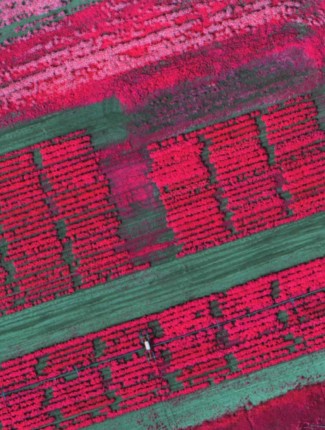
Although there are several vegetation indices, one of the most widely used is the Normalized Difference Vegetation Index (NDVI). NDVI values range from +1.0 to -1.0. Areas of barren rock, sand, or snow usually show very low NDVI values (for example, 0.1 or less). Sparse vegetation such as shrubs and grasslands or senescing crops may result in moderate NDVI values (approximately 0.2 to 0.5). High NDVI values (approximately 0.6 to 0.9) correspond to dense vegetation such as that found in temperate and tropical forests or crops at their peak growth stage.
By transforming raw data into NDVI values, researchers can create images and other products that give a rough measure of vegetation type, amount, and condition on land surfaces around the world. NDVI is especially useful for continental- to global-scale vegetation monitoring because it can compensate for changing illumination conditions, surface slope, and viewing angle. That said, NDVI does tend to saturate over dense vegetation and is sensitive to underlying soil color.
NDVI values can be averaged over time to establish “normal” growing conditions in a region for a given time of year. Further analysis can then characterize the health of vegetation in that place relative to the norm. When analyzed through time, NDVI can reveal where vegetation is thriving and where it is under stress, as well as changes in vegetation due to human activities such as deforestation, natural disturbances such as wild fires, or changes in plants’ phenological stage.
Reviews
There are no reviews yet.